How to read app crash reports when you are not a developer
Crash reports show who is affected, on which version and which phone. How to read them without code, rank what to fix first and what to ask your developer.
· 10 min read
Your developer says the app is stable. A review says it closes on the payment screen. The report in front of you is a wall of code, and nobody has told you which number to trust. You do not need to read code to read a crash report. You need four questions, a sense of where the numbers come from and a list of what to ask the person who fixes the app.
In short
- Count people, not crashes. One user stuck in a crash loop can produce a long run of crash events. Look at how many users are affected, and rank the problems by that.
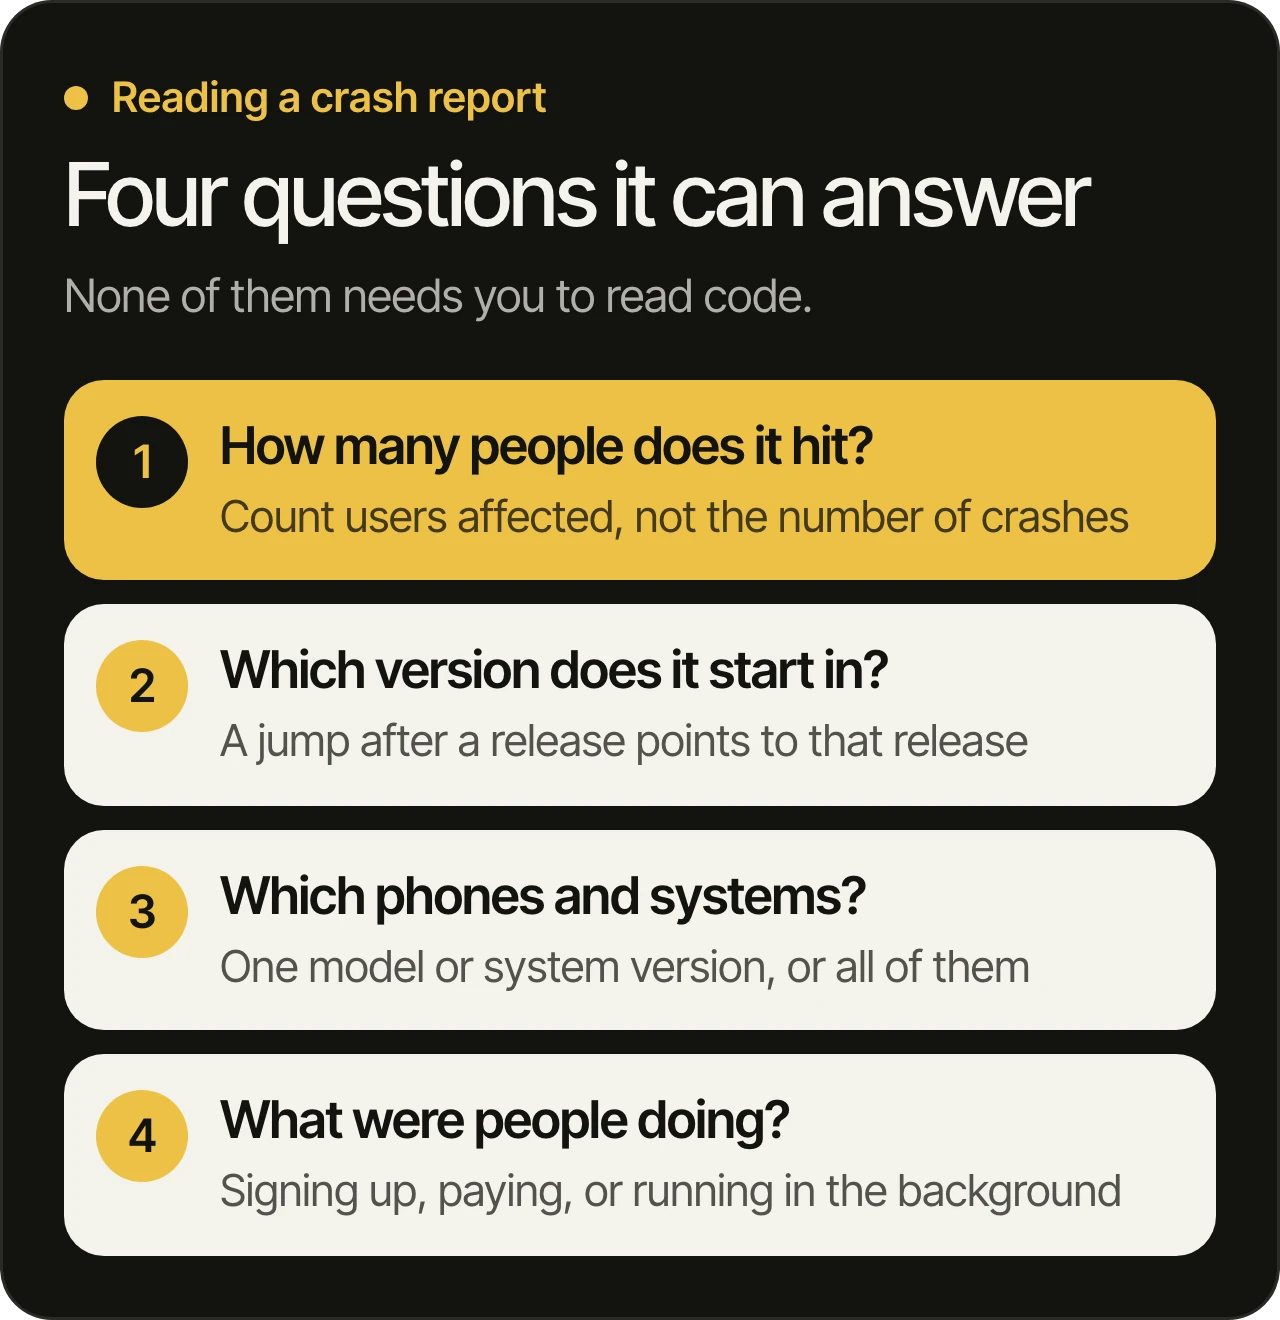
- Every crash report answers four questions: how many people it hits, which version it starts in, which phones and system versions, and what people were doing when it happened.
- You can read the top of a stack trace. It says what went wrong and where. The lines below it are mostly the phone’s own code, and your developer reads those.
- Rank crashes the way you rank every fix. What stops people from doing the main thing comes first, then what reaches the most users, then what began with the newest version.
Where your crash reports live
Both stores collect crashes for you. A dedicated crash tool adds more detail, but start with what you already have.
On Apple’s side
Apple’s Xcode has a Crashes organizer. Apple says TestFlight and the App Store collect crash reports for every submitted version of your app, and the organizer shows reports from customers who agree to share diagnostic and usage information. TestFlight testers share crash reports automatically. The App Crashes report (opens in a new tab) in App Store Connect groups crashes by app version and device type, and it shows the total number of crashes next to the number of unique devices where the app crashed. Apple includes only users who chose to share their data, and it reports a number only when enough users have an event.
Apple also states that some crash types do not appear in the Crashes organizer: watchdog events such as a slow launch, invalid code-signature crashes, thermal events and high memory use. Apple describes other ways to collect those (opens in a new tab). If reviews say the app will not open and your reports look clean, ask whether these types have been checked.
On Google’s side
Google Play’s Android vitals (opens in a new tab) in Play Console measures three crash rates. The crash rate is the share of daily active users who had any crash. The user-perceived crash rate counts users who had at least one crash while they were actively using the app. The multiple crash rate counts users who had at least two.
The user-perceived crash rate is a core vital, which means it affects how easily people find your app on Google Play. Google sets bad behavior thresholds on it. If your app goes over the overall threshold, Google says it is likely to be less discoverable on all devices. If it goes over the per-device threshold, it is likely to be less discoverable on those devices, and a warning may appear on your store listing. Play Console can alert you when crashes get excessive, and you can open each crash’s stack trace there.
In a crash tool
Many teams add a crash tool such as Firebase Crashlytics to both apps, so the numbers sit in one place. Its crash-free users figure is the share of users who used the app in a chosen period without a crash. Its crash-free sessions figure is the share of sessions that did not end in a crash. Two cautions come straight from its documentation: do not compare crash-free users across different date ranges, because a longer period gives every user more chances to crash, and be careful with opt-in reporting, which can make the numbers less representative. Read the crash-free metrics page (opens in a new tab) before you put a number in a board report.
Every one of these sources counts a little differently. Pick one, note its definition and compare like with like.
Four questions every crash report answers
How many people does it hit?
Look for affected users first. A crash count tells you how often it happened. A user count tells you how many people it happened to. One person whose app crashes each time it opens adds up to a large crash count and a small problem. The same count spread across many users is a large problem. If a report shows only a total, ask for the user figure too.
Which version does it start in?
Find the first version where the crash appears. If it began with the latest release, a change in that release caused it, and the list of changes in one version is short enough for a developer to read. If it appears in every version, it has been there for a long time. A crash that disappears after a fix and comes back two releases later is missing something else: a test that keeps it fixed. We explain that in how we test and review every change.
Which phones and system versions?
If every crash comes from one phone model or one system version, the app was not tested on it. If crashes spread across everything, the cause is in the app’s own logic. The first kind is a testing gap. The second needs a closer look at the code.
What were people doing?
Ask which screen or step the crash belongs to. A crash on the payment screen costs you revenue. A crash on a settings page costs you less. Android vitals counts crashes that happen while people are actively using the app, and Google calls those the most disruptive. Android’s own documentation also points out that any component can crash, even one running in the background, and that these crashes often confuse users because they were not using the app.
This is also where the reviews help. If you have already sorted yours by cause, as we describe in how to analyze app store reviews, take the crash pile and check it against these numbers. A review that names a version and a phone tells you where to look in the report.
How to read the top of a stack trace
A stack trace is the record a crash leaves behind. It looks like noise, but Android’s documentation says it holds two critical pieces of information: the type of exception thrown, and the section of code where it was thrown. You can read both.
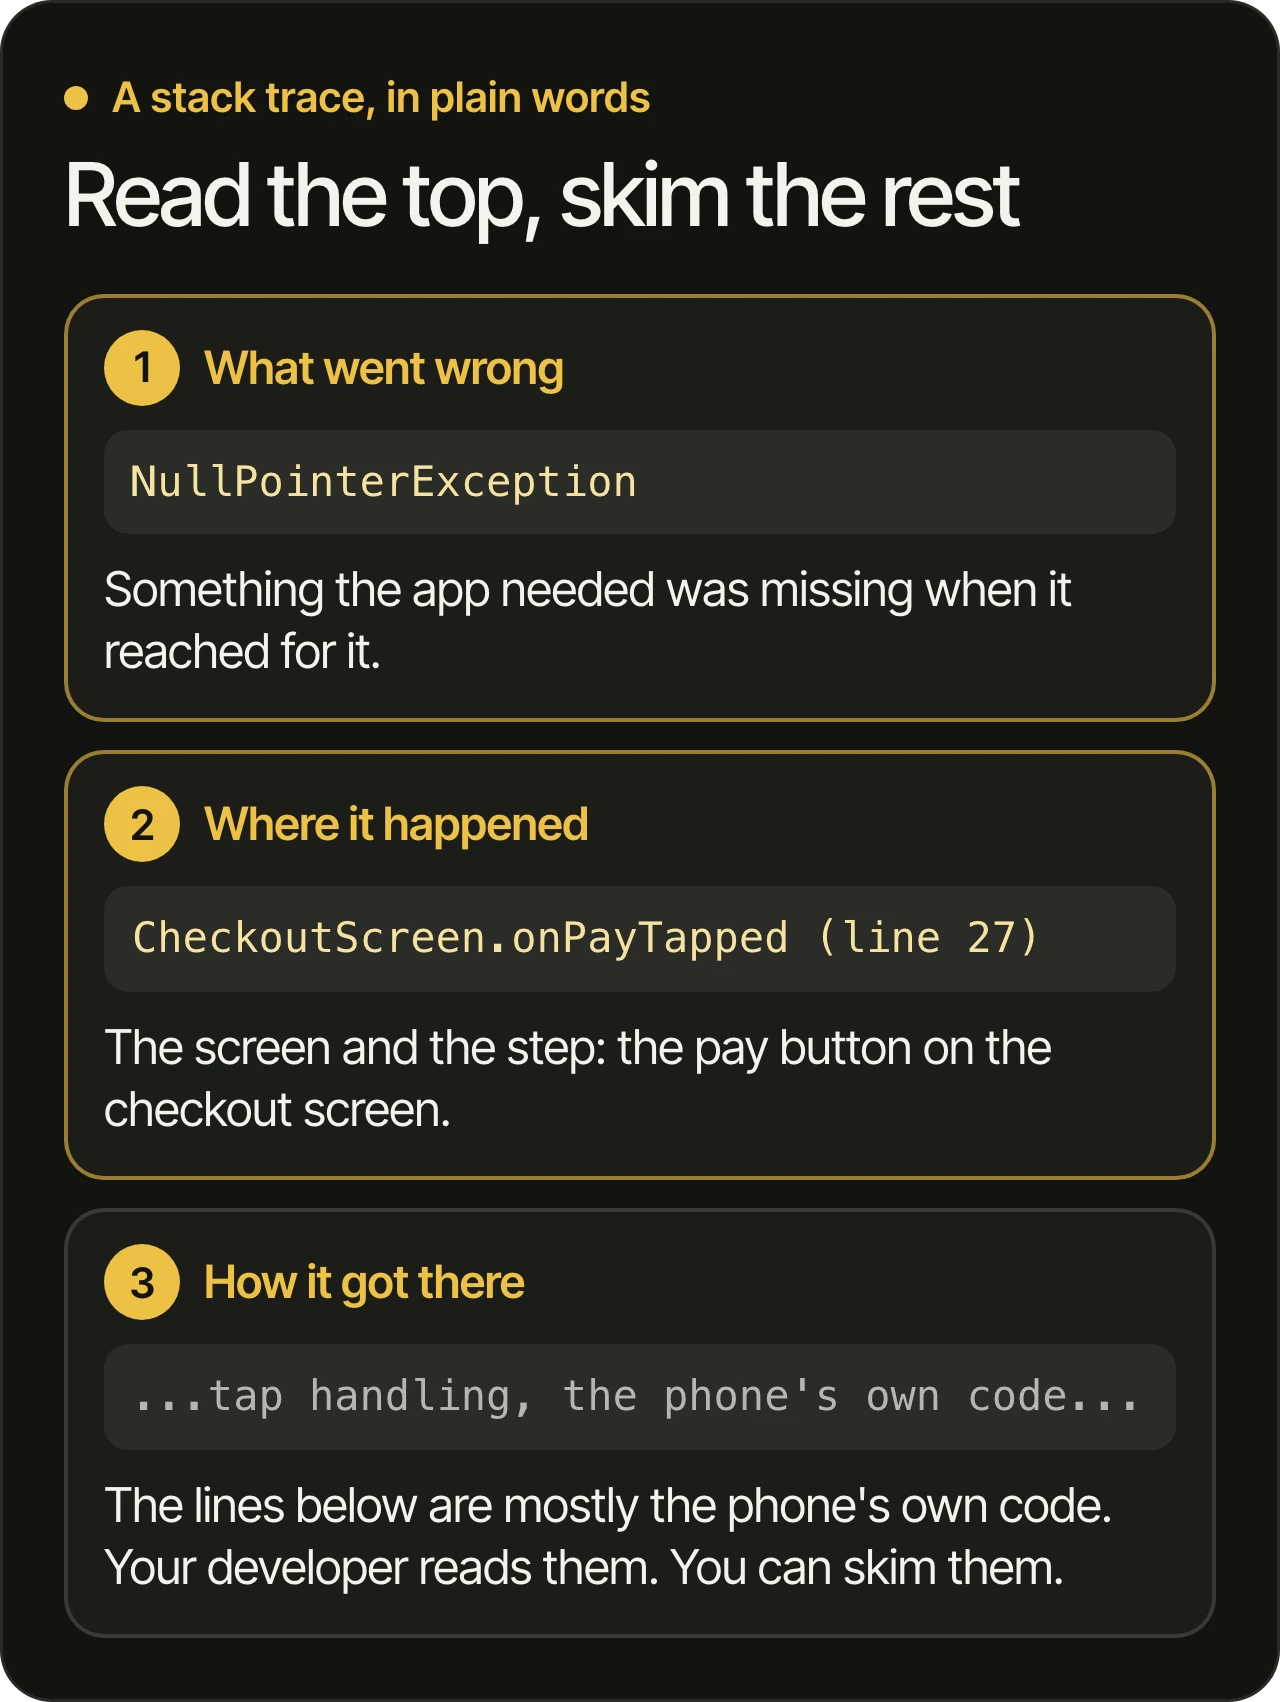
- What went wrong. The first line names the kind of error. Android says the type is usually a strong hint about what happened. The commonest is the null pointer exception, which means the app reached for something that was not there. Android’s documentation names it as the largest cause of app crashes on Google Play.
- Where it happened. The next line gives the screen or function, and often the file and line. “Checkout screen, pay button” is something you can act on without opening the code.
- How it got there. The lines below are the chain of calls that led to the crash. Many of them belong to the phone’s system. Leave them to your developer.
Two things in a report are worth a question:
- A network error that crashes the app. Android’s documentation says that, because people constantly move in and out of coverage, network exceptions should be treated as normal operating conditions and not as errors. If a lost connection crashes your app, the app was not built for how people really use it. This matters a great deal wherever connections drop, and we wrote about it in mobile app development in Lebanon.
- A report full of numbers instead of names. Apple says a crash report that is not symbolicated shows hexadecimal addresses instead of function names and line numbers, which makes diagnosis harder. Apple’s reports contain the names automatically when symbol information is included in the build submitted to the App Store. Android reports for native code need a debug symbols file uploaded to Play Console. If your reports are unreadable, ask whether the symbols were uploaded.
Which crash to fix first
You will rarely fix every crash in one go, so put the groups in order. The order we use is the same order we use for every other problem in a live product.
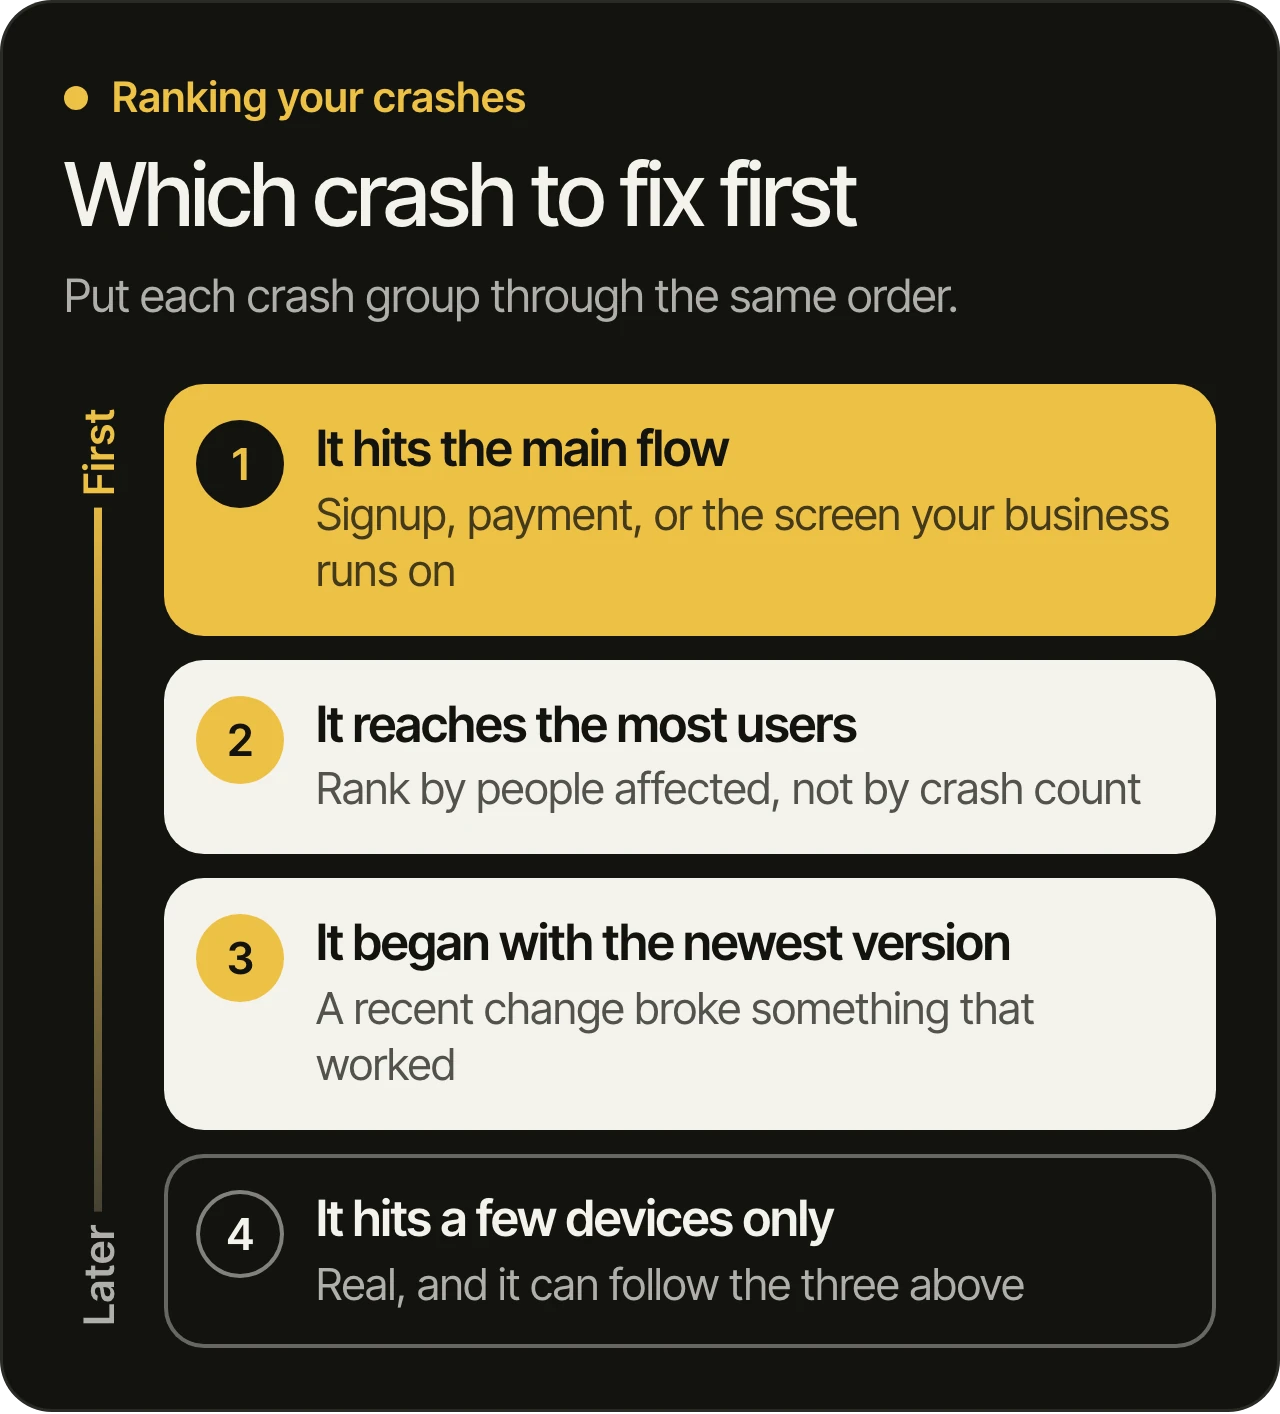
- It hits the main flow. A crash on signup, payment or the one screen your business depends on goes first, even when few people reach it.
- It reaches the most users. After that, the groups that affect the most people.
- It began with the newest version. A recent change broke something that worked, and a recent change is the easiest thing to read back.
- It hits a few devices only. Real, and worth a fix, but it can follow the others.
What to fix first has the full order we use across a product, and crashes are only one input to it. If you would rather have someone go through your reports with you, that is part of what the audit at the start of a product takeover covers.
What to ask your developer or agency
Take these to your next conversation. Each one has a plain answer, and the answer tells you whether anyone is watching the app.
- What are the top crash groups right now, ranked by users affected? You should get a short list for each platform, not a total.
- Which version did each one start in? If nobody can say, nobody is comparing releases.
- Is it fixed, and in which version? A fix has a version number. “We are looking into it” is not a status.
- What test now covers it? A crash fixed without a test comes back.
- Are the symbols uploaded, and are reports coming from all users? Unreadable or partial reports hide problems.
- Can the reports be opened with an account in your name? Store accounts and crash tools belong to you. If only your agency can see them, you cannot check its work. We wrote about this in what we check first when we take over an app.
Questions owners ask
What is a good crash-free rate?
There is no single figure that fits every app. The two honest comparisons are your own previous release, over the same date range, and the thresholds the store applies to you. Google defines bad behavior thresholds for the user-perceived crash rate in Android vitals and says exceeding them can make your app less discoverable. Check your current numbers in Play Console rather than quoting a rule of thumb.
Why do reviews mention crashes that the reports do not show?
There are a few usual reasons. Apple’s data comes only from users who share diagnostics, and some crash types, such as watchdog events and high memory use, are not in the Crashes organizer. Some complaints are freezes or blank screens that do not count as crashes. And a review may describe an older version that the report no longer highlights. Ask your developer to check each reason in turn.
Can an owner read crash reports without a developer?
Yes, up to a point. You can read the summary figures, see which versions and devices are affected and read the first two lines of a stack trace. Finding the cause and fixing it takes a developer. The goal is that you can tell whether the report you are given makes sense.
Does a crash always mean there is a bug in our code?
No. A crash can come from a change in a new system version, a phone running out of memory or a network failure the app did not handle. These still need a fix, but the fix may be handling the situation properly and not changing the feature. A developer can tell the difference from the stack trace.
Do we need a separate crash tool?
The stores’ own reports are enough to start. A crash tool adds crash-free figures for users and sessions, notes and logs attached to each crash, and one view across both apps. If you cannot answer the four questions with what you have, add one.
What to do with the numbers
A crash report is a list of where your product lets people down, in order of how many of them it reaches. Read the top, ask the four questions and rank what you find. If you would like a second pair of eyes on yours, we go through your product before the free 45-minute consultation and show you what we would look at first. You can also read about our services and how we work.